Data Acquisition
At the end of each session, the timeUp() function stops Bpod and Bonsai, then executes fmon_data_output.m, a MATLAB script that saves and summarizes the recently acquired data.
The data output script handles copying and saving Bpod session data, NiDAQ data, and video files. Additionally, the script creates a summary of session information and mouse performance, then saves and displays it as a text file.
These data are all saved in the appropriate directory. Directories are organized by mouse ID, session type, and session number. For example, data for Mouse 1234, 100-0 task, session 5, will be saved to D:/fmon_data/1234/100-0/5/
Saved Data
In each session folder you will find:
- BpodSessionData.mat
- Data recorded by Bpod and stored as a MATLAB struct. Includes detailed timing data for state changes and trial events.
- NiDAQ_poke.dat
- Binary data file containing voltages for left, (ch1) right, (ch2) and initiation reward (ch3) ports.
- NiDAQ_sniff.dat
- Binary data file containing voltages from thermistor (ch1) camera TTL trigger (ch2) and left (ch3) and right (ch4) final valves.
- notes.txt
- Summary file generated at the end of each session. Contains session information, mouse performance, and (optional) experimenter notes.
- rawvideo.txt
- Bonsai timestamps of for each video frame captured.
- rawvideo202x-xx-xxTxx_xx_xx.avi
- Raw video file captured by Bonsai.
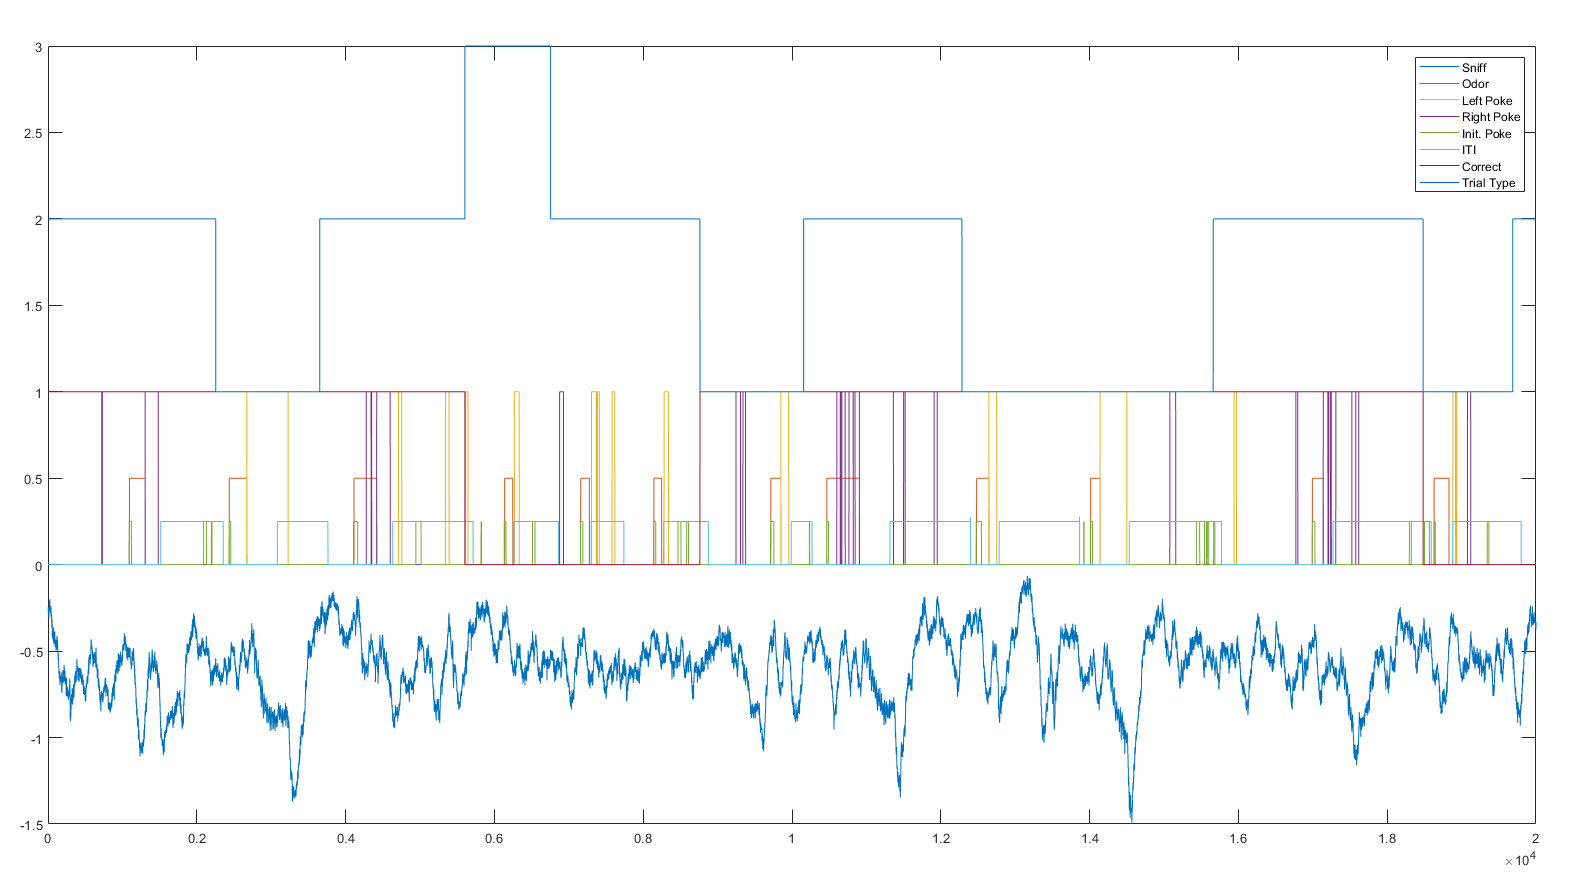
Data Processing
Prior to analysis, data from Bonsai and Bpod must be processed and temporally aligned. I’ve broken the pipeline into a series of functions, which can be executed in order using fmon_data_builder.m then visualized with fmon_data_visualize.m. An example visualization is shown below.